PayMongo Group, a fintech company that provides a financial operating system for businesses, processed almost twice the transaction volume in the first half of 2026 compared to the same period last year – nearly 10 million completed transactions across a merchant base that grew 93% year-over-year.
Below are the most significant findings on how Philippine businesses are paying and getting paid based on their data.
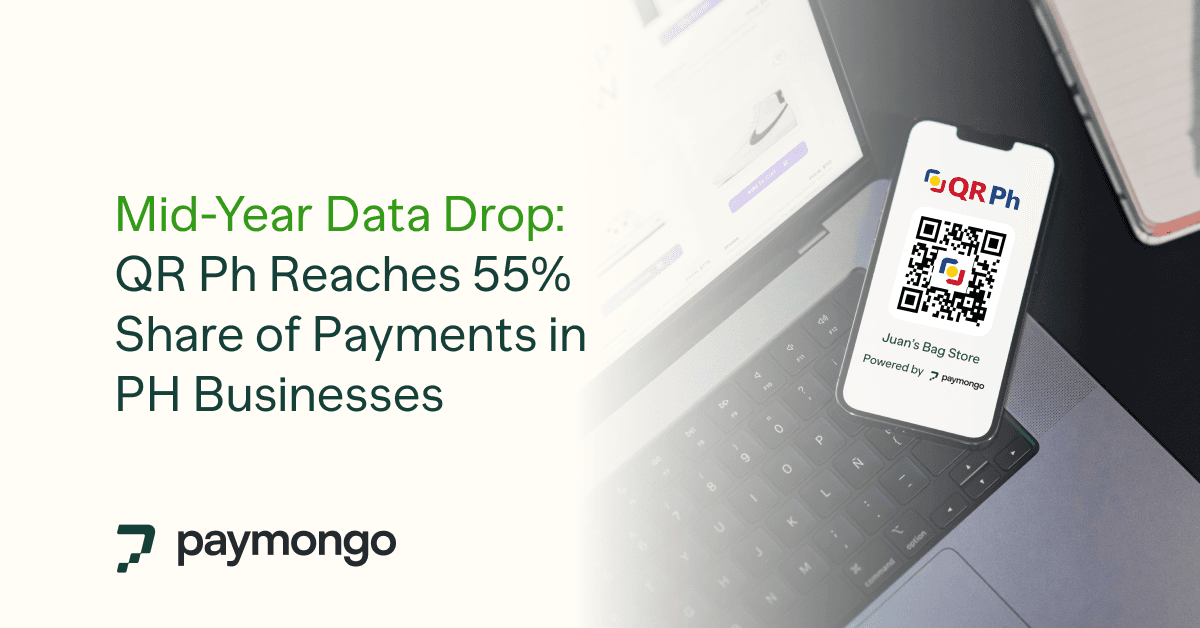
#1: QR Ph now commands more than half of all payment volume – more than cards and e-wallets combined
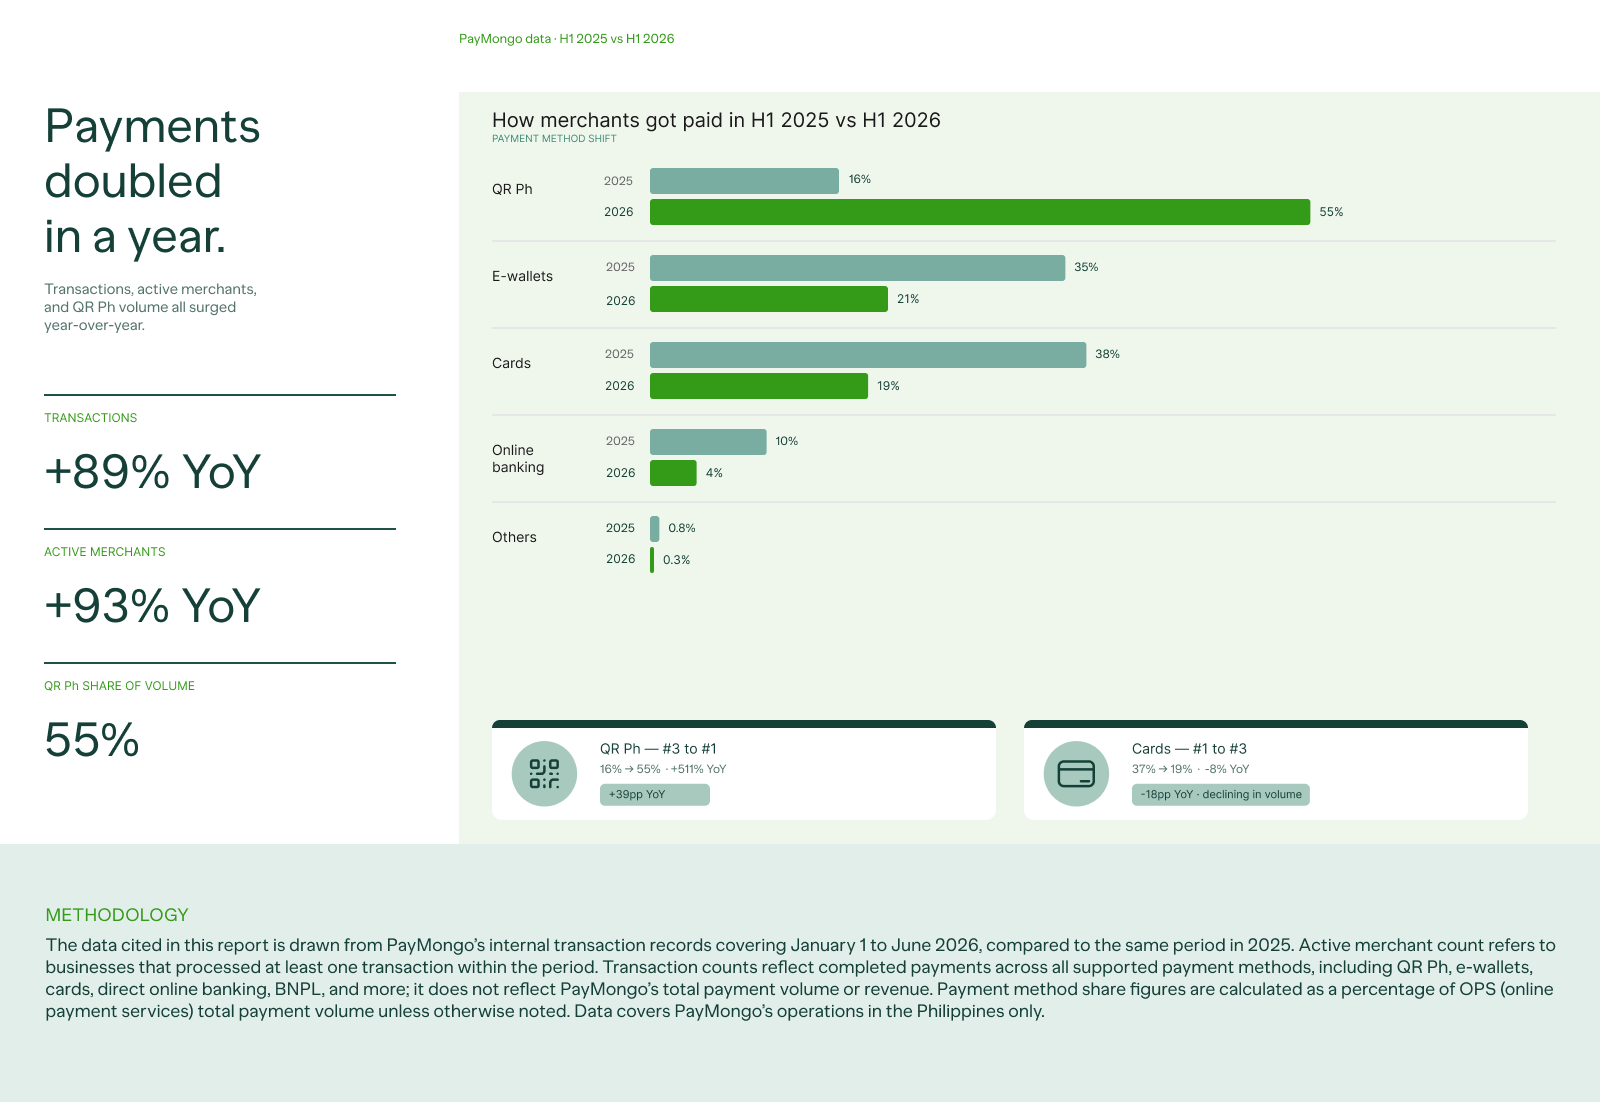
In 2025, QR Ph represented just 16% of total payment volume on the platform. Cards led at 38%. This year, that order has completely reversed – QR Ph now commands more than half of the payment volume (with more than 510% YoY growth), while cards have declined not just in share but in absolute volume, down 8% year-over-year. Additionally, direct online banking declined by 26% year-over-year.
QR Ph now accounts for 55% of all payment volume on PayMongo's platform. Cards and e-wallets – once the top two methods – have been pushed to 19% and 21% respectively. Everything else, including online banking and BNPL, makes up less than 5%.
QR Ph and e-wallets combined account for 76% of total payment volume and 9 in 10 transactions, a signal that Filipino merchants are becoming mobile-first.
Cards tell a different story. Despite representing 19% of total payment volume – almost matching e-wallets’ 21% share – card transactions account for just 7% of all transactions. The average card transaction is significantly higher in value than a QR or wallet payment: cards remain the instrument of choice for high-ticket purchases, corporate expenses, and one-time large payments. Everyday transactions, such as the sari-sari top-up, the food delivery order, the utility bill, have moved entirely to mobile-native payment methods.
What makes QR Ph's dominance more than a trend is its interoperability: a single QR code accepts payments from participating banks and e-wallets. For small businesses managing multiple payment terminals or apps, this consolidation simplified everything, which may explain why adoption has accelerated fastest among non-technical merchant segments.
#2: Transactions significantly increased as more businesses moved to digital payments
PayMongo’s infrastructure recorded nearly 10 million completed transactions from January to June 2026. The merchant base driving this volume spans online stores, physical retailers, service businesses, and enterprises that have embedded PayMongo directly into their customer-facing products.
That's an 89% increase from nearly 5.2 million transactions processed in the same period last year.
#3: A growing need for user-friendly e-commerce checkouts
PayMongo's largest merchants by payment volume have built the platform directly into their websites and apps via APIs, the kind of seamless checkout experience where a customer pays without ever knowing which payment company is running behind the scenes. The more telling growth story, however, is in the channels built for merchants who have no technical team.
Shopify merchants grew 18% year-over-year with payment volume up 6%. These are Philippine online sellers who have moved from informal marketplaces into structured storefronts, with payments infrastructure that previously required a banking relationship to access.
PayMongo Pages, the platform's no-code payment page product, tells a similar story at an earlier stage of the merchant journey: merchants collected almost a billion in payments without a single line of code. For small businesses that cannot afford web development, Pages has functionally eliminated the barrier between accepting cash only and accepting digital payments.
#4: In-store QR Ph transactions more than tripled year-over-year
The in-store picture adds another dimension. Merchants are now processing payments through PayMongo's in-store QR Ph product, more than double doing so a year ago. This is the same QR infrastructure behind the platform’s dominant online sales volumes, now extending into physical retail, food service, and service businesses across the country. In-store QR Ph transactions grew more than 3x year-over-year.
Taken together, these channels reflect a platform that has moved well beyond site-only adoption. The merchants on PayMongo in 2026 are as likely to be a local neighborhood store collecting QR payments as they are a funded startup running transactions through an API-integrated checkout.
Conclusion
For the Philippine payments industry, this trend is consistent with BSP’s digital transformation roadmap. PayMongo’s merchant data may suggest its impact.
This report captures the velocity of Philippine digital commerce as a whole. The infrastructure is in place, the behavior has changed, and the second half of 2026 will show whether that pace holds or accelerates further.
Methodology
The data cited in this report is drawn from PayMongo’s internal transaction records covering January 2026 to June 2026, compared to the same period last year, January 2025 to June 2025.
Active merchant count refers to businesses that processed at least one transaction within the period. Transaction counts reflect completed payments across all supported payment methods, including QR Ph, e-wallets, cards, direct online banking, BNPL, etc.; it does not reflect PayMongo’s total payment volume or revenue. Payment method share figures are calculated as a percentage of OPS (online payment services) total payment volume unless otherwise noted.
Data covers PayMongo’s operations in the Philippines only.
About PayMongo
PayMongo Group is a fintech company that provides a financial operating system for growing businesses in the Philippines. It enables merchants to accept payments, move money, and borrow capital through a single, unified platform. From startups and SMEs to enterprises, thousands of Filipino merchants across retail, food, e-commerce, and services trust PayMongo to run their financial infrastructure. PayMongo is regulated by the Bangko Sentral ng Pilipinas (BSP) and is PCI-DSS 4.0 and SOC 2 Type 2 certified.